Pattern maps are designed to show a particular set or pattern of things such as precipitation, population, food crops, and so on.
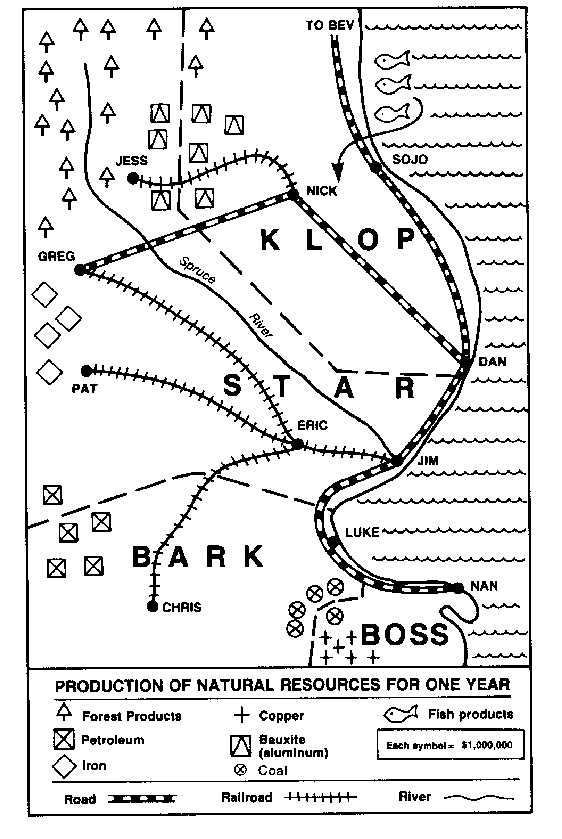
The map below is a pattern or distribution map. The map shows the distribution of natural resources among four imaginary states.
- What was the value of Klop's fish product?
_____ $1 million
_____ $2˝ million
_____ $3 million
_____ $3˝ million
- What was the total value of Star's forest products? ____________________________________________
- In which state would you expect to find the most oil refineries? ___________________________________
- Which port city is most likely to be the busiest port?
____________Dan
____________Jim
____________Sojo
____________Luke
- What two things are most likely transported on the train from Jess to Nick? ____________and ___________
- What product is most likely transported from Pat to Eric? _________________________________________
- In what city would you expect to find a fish cannery?
- In what city would you find the most important train centre?
- Arrange the states in order of the value of their production of natural resources with the highest state listed first.
| State | Production (in millions of dollars) |
|---|
| | | | |
| | | | |
| | | | |
| | | | |
- The only state that has mountains is Star. The mountains form a great valley for the Spruce River. Draw mountains on both sides of the river from the far north to the road from Greg to Nick.