
| A | B | C | D |
|---|---|---|---|
 |
 |
 |
 |
 One Unit of Population One Unit of Population One Square km One Square km
| |||
 | Choose suitable words from the list below and insert them into the table. Complete the rest of the table by inserting the correct density information. Give the population density as: x/sq.km. |
| Distribution: | Dispersed Concentrated |
| Distribution | Density | Population Density | |
| Map A | |||
| Map B | |||
| Map C | |||
| Map D |
| Density: | Sparse Medium High |
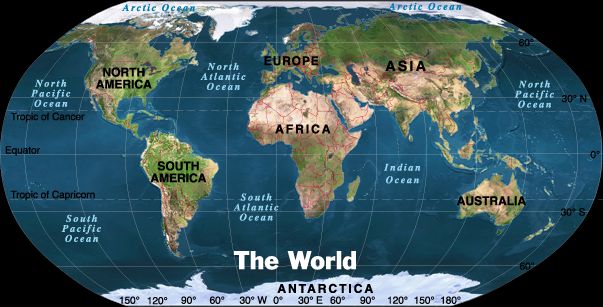
| Study the map of the world and the other picture sources of different regions of the world and then write a short (200 word) essay on why people choose to live in some areas of the world and not in others. Make comparisons and outline a few specific points. Then answer the remaining questions. |
 |   |

| A: Number | B: Name of Region | C: Density | D: Description of Region |
|---|---|---|---|
| 1 | |||
| 2 | |||
| 3 | |||
| 4 | |||
| 5 | |||
| 6 |
| There are 260,000 people in The Bahamas. How long does it take for the world's population to increase to reach the size of the Bahamian population? |
| List FIVE problems that are associated with with this rapidly increasing population. |
| Increasing birth rate | |
| Steady birth rate | |
| Decreasing birth rate |
| Look at the table below and complete the blanks from the list of alternatives given. For each box give an example of a location in the world. |
| Physical | |
|---|---|
| Areas of difficulty | Areas of Attraction |
| Relief | |
| Drainage | |
| Climate | |
|---|---|
| Areas of difficulty | Areas of Attraction |
| Rainfall | |
| Temperature | |
| Soils | |
|---|---|
| Areas of difficulty | Areas of Attraction |
| Resources | |
|---|---|
| Areas of difficulty | Areas of Attraction |
| City | Population in Millions 1980 | Population in Millions 2000 (estimate) |
|---|---|---|
| Mexico City | 13 | 31 |
| Sao Paulo | 13 | 26 |
| Tokyo | 20 | 26 |
| New York | 18 | 22 |
| Calcutta | 9 | 20 |
| Rio de Janeiro | 10 | 19 |
| Shanghai | 12 | 19 |
| Beijing (Peking) | 10 | 19 |
| Bombay | 8 | 19 |
| Seoul | 9 | 18 |
| Jakarta | 7 | 17 |
| Cairo | 9 | 17 |
| Karachi | 6 | 16 |
| Los Angeles | 11 | 15 |
| Buenos Aires | 10 | 14 |
| World region | Africa | Asia | Australasia | Latin America | North America |
|---|---|---|---|---|---|
| Number of biggest cities in year 2010 |
| From the information you have gathered on the map and the chart, write a short essay. Describe in which parts of the world you see the most population growth. Why do you think cities are growing so much in these areas? |
| Complete the diagrams below by listing some reasons why the country pushes people "out" and why cities pull people "in". |
 |  |
 |  |